
参考范文
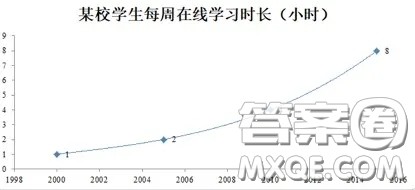
As is clearly demonstrated in the line chart, there is a series of figures showing weekly online learning time of the students in a university. It can be seen that weekly online learning time increased steadily from 2000 to 2015, starting from 1 hour in 2000, undergoing 2 hours in 2005 and 4 hours in 2010, and eventually ending up with 8 hours in 2015.
What are the invisible reasons behind the phenomenon reflected by the chart? First and foremost, with the society becoming increasingly rich, more and more students can afford to purchase their own computers. What’s more, the information technology is so mature and developed that the Internet has become available to most of the students, be it in the classroom, the playground or their dormitories.Last but not least, the resources of online education have exploded these years, which can provide the students with much more diverse online courses of the most renowned teachers with the best quality.
From what has been analyzed above, we can easily come to the conclusion that there is a tendency that weekly online learning time of the students in the university will continue to increase in the years to come.
 某市绿化面积分析大学生英语作文 关于某市绿化面积分析的大学生英语作文
2020-12-28 15:52:16
参考范文The statistics offered by the chart above illustratethe changes in the number of the green area versus time in a city. It can be seen that the green are
 空巢老人现象大学生英语作文 关于空巢老人现象的大学生英语作文
2020-12-28 15:36:23
Nowadays(现在,现今,如今) it is common to see that many parents focustheir attention on their children, but leave their own parents without proper(适当的,正确的,规矩的,
 某市居民消费方式调查英语作文 关于某市居民消费方式调查大学英语作文
2020-12-28 13:50:05
The chart given above depicts that the way of payment witnessed a dramatic change in a certain city of China in the past few years. From 2015 to 2017, the propo
 旅游纪念品天然玉石漫画英语作文 关于旅游纪念品天然玉石的漫画英语作文
2020-12-28 13:30:59
What an eye-catching and thought-stimulating picture. As is reflected by the drawing, a traveler would like to buy some souvenirs in the scenic store. The visit